Habidatum — Making Cities Smarter with Urban Analytics

This project shows early work on complex B2B workflows and stakeholder alignment.
| Year | 2016–2017 |
| Role | Product Designer |
| Scope | Product Design, UI/UX, Data Visualization, Prototyping |
In 2016, I joined Habidatum, a small but ambitious startup working in the emerging field of urban analytics. Our goal was to make complex spatial data — everything from Twitter check-ins to custom mobility datasets — accessible and actionable for city planners, developers, and architects.
For a company competing with bigger, more established players, design wasn't just about polish. It was a competitive advantage.
Context
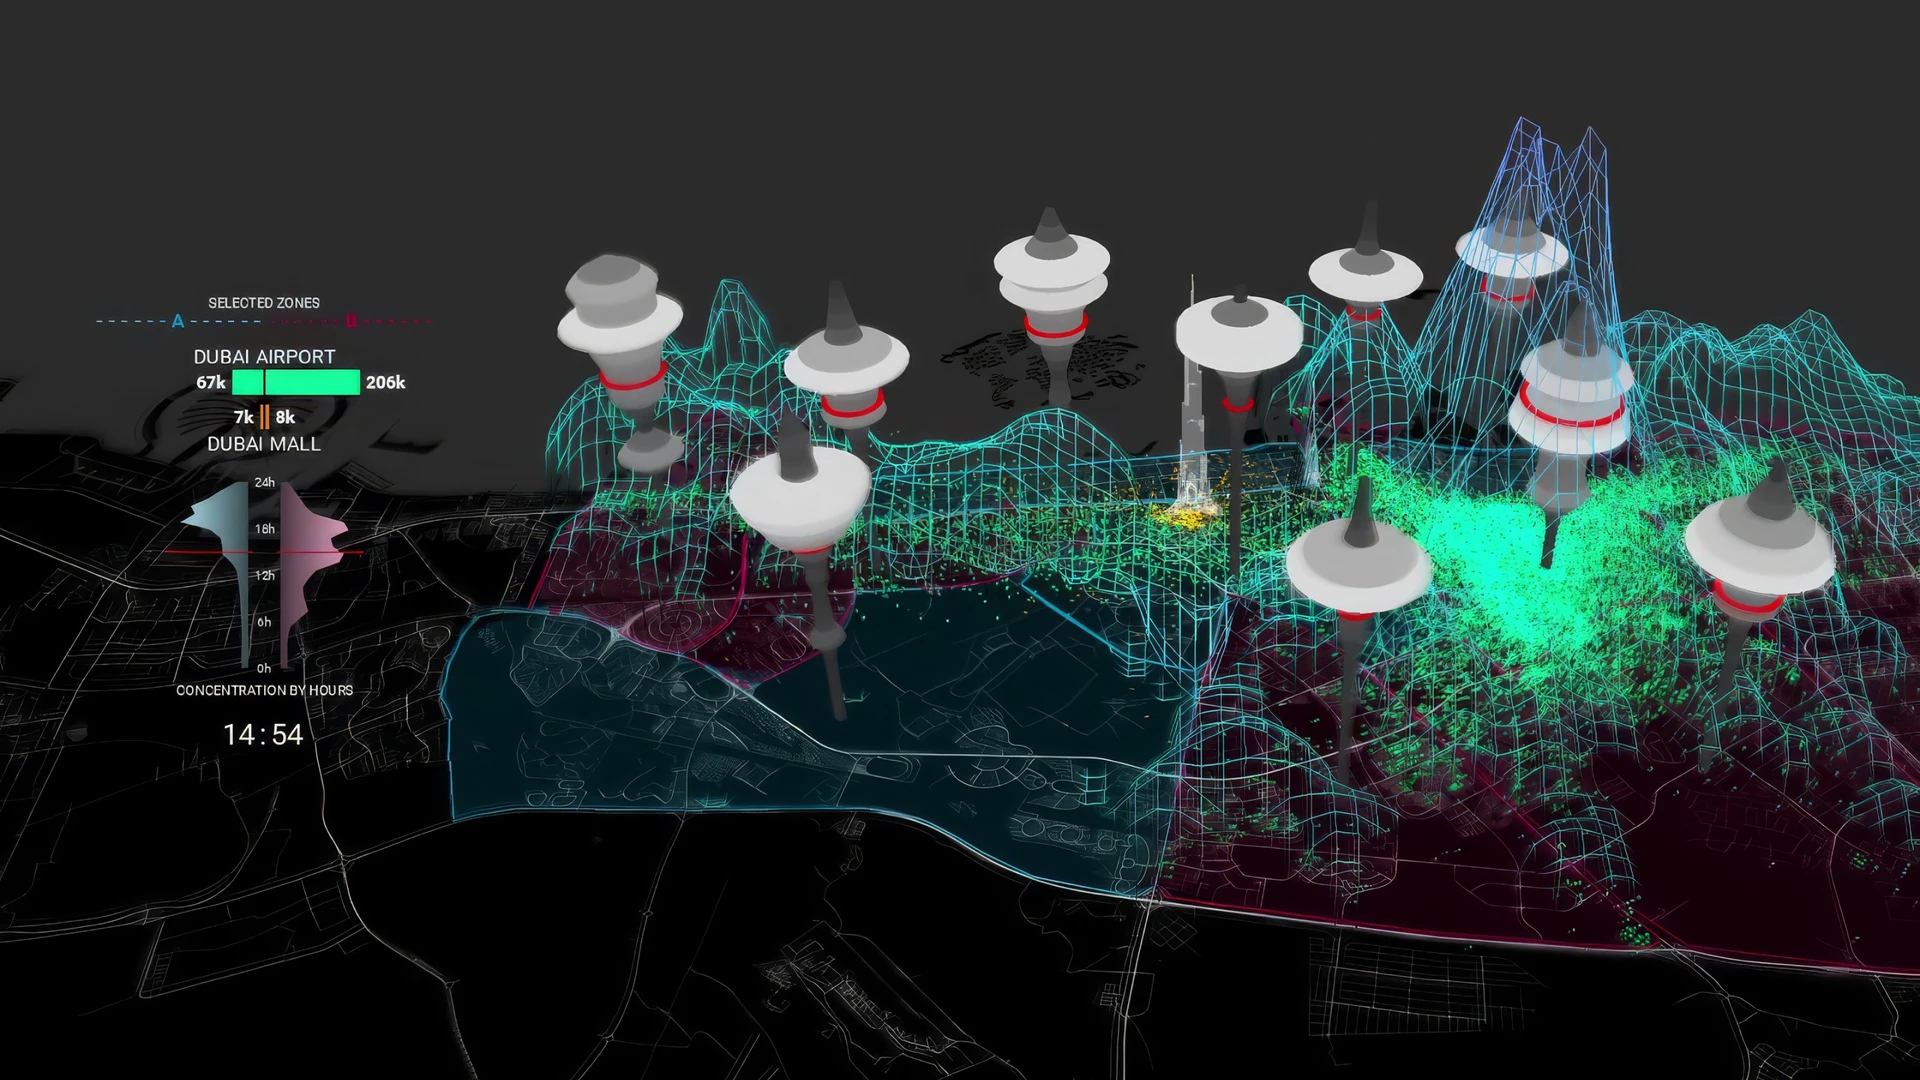
Habidatum was building Chronotope, a geo-spatial SaaS platform. It allowed users to collect, visualise, and interpret urban data in real time.
Our challenges were significant:
— Onboard our first enterprise clients.
— Prove that small teams can deliver powerful analytics products.
— Make complex data tools usable for non-experts, not just data scientists.
— Build credibility by showing up at global smart city events.
The problem
We faced several critical challenges. Onboarding barriers made uploading and setting up data too complex for new users. Our fragmented design process meant old assets were scattered across .psd and .sketch files, making it hard to maintain consistency. Collaboration issues arose because designers worked on different platforms (Mac/Windows), which hurt design continuity. Additionally, market pressure required us to show results quickly to win contracts.
My role
I started as the sole designer and eventually became the design lead. My responsibilities included designing and updating platform interfaces using Sketch, Principle, and front-end prototypes. I built interactive prototypes with JS, HTML, CSS, and Git. I introduced Figma (still in beta in 2017) to unify the team's workflow. I ran user interviews with data scientists, architects, and managers. I maintained the design library and onboarded new designers. I also delivered client-facing visualisations and presentations.
Process
Discovery
We conducted over 20 interviews with potential users: internal data scientists, architects, and external stakeholders. Their feedback revealed friction in data upload, dashboard navigation, and onboarding.
Ideation
We redesigned Chronotope's platform into four components:
— Backend + dashboard for data upload and tuning.
— Front-end for complex visualisation and knowledge base.
— A modular system for enterprise clients to build customised instances.
— A landing page for beta subscriptions.
Design system
Cross-platform collaboration was a pain point. By introducing Figma (early adopter!), we built a reusable library of components, categorised designs, and improved version control. This alone boosted velocity and reduced errors dramatically.


Client work
Alongside the platform, I designed interactive data visualisations for client projects, optimised for web and mobile. These included plots, charts, and multi-screen dashboards. Visual performance was critical: datasets were massive and real-time monitoring demanded smooth interactions.
Delivery
We shipped a new beta of the platform within a year, onboarded our first enterprise clients, and presented at the Smart City Expo in Dubai and Barcelona.
Results
— 5 enterprise clients onboarded within the first year.
— Conducted 20+ user interviews to refine UX.
— Reduced onboarding time from 5 days to 3 days (~40% faster), lowering barriers for new users.
— Established a cross-platform design workflow with Figma, boosting team velocity.
— Delivered multiple mobile-optimised client visualisations.
— Increased company visibility with booths at global smart city expos.
Challenges & tradeoffs
— Performance vs design. Complex data visualisations had to remain fast and responsive, even with huge datasets.
— Cross-platform pain. Balancing Mac/Windows design workflows required adopting new tools.
— Resource stretch. As a small team, we had to juggle platform work, client projects, and marketing simultaneously.
Learnings
— Design = credibility. In competitive B2B markets, a well-designed product helped us win contracts against bigger players.
— Adopt tools early. Figma (still in beta) gave us a huge collaboration advantage.
— UX for non-experts. Making analytics accessible to architects and managers proved as important as serving data scientists.
Closing thoughts
Habidatum was my first real experience of using design as a strategic differentiator in B2B SaaS. We weren't just making charts prettier — we were making cities smarter, helping clients see patterns they couldn't before.
It taught me that even in highly technical fields like urban analytics, design can tip the balance between being a niche tool and becoming a platform that organisations trust.